Code
import numpy as np
import matplotlib.pyplot as plt

r = np.arange(0, 2, 0.01)
theta = 2 * np.pi * r
fig, ax = plt.subplots(
  subplot_kw = {'projection': 'polar'}
)
ax.plot(theta, r)
ax.set_rticks([0.5, 1, 1.5, 2])
ax.grid(True)
plt.show()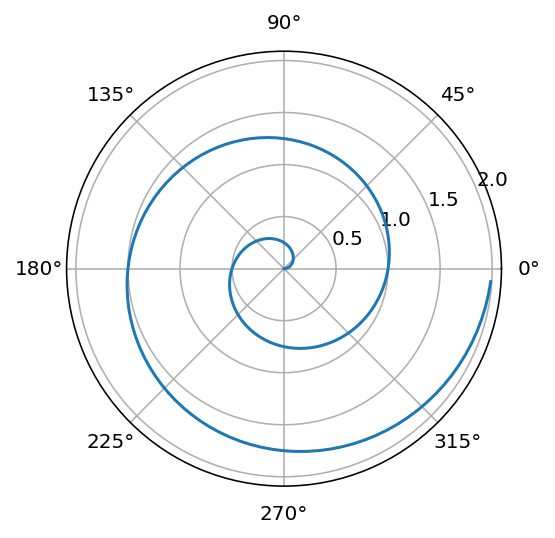
For a demonstration of a line plot on a polar axis, see Figure 2.
import numpy as np
import matplotlib.pyplot as plt
r = np.arange(0, 2, 0.01)
theta = 2 * np.pi * r
fig, ax = plt.subplots(
subplot_kw = {'projection': 'polar'}
)
ax.plot(theta, r)
ax.set_rticks([0.5, 1, 1.5, 2])
ax.grid(True)
plt.show()import numpy as np
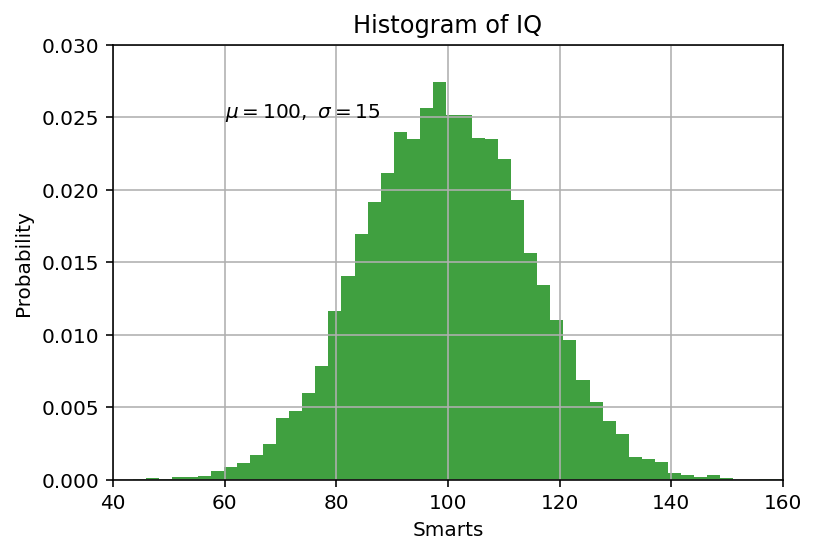
import matplotlib.pyplot as plt
# Fixing random state for reproducibility
np.random.seed(19680801)
mu, sigma = 100, 15
x = mu + sigma * np.random.randn(10000)
# the histogram of the data
n, bins, patches = plt.hist(x, 50, density=True, facecolor='g', alpha=0.75)
plt.xlabel('Smarts')
plt.ylabel('Probability')
plt.title('Histogram of IQ')
plt.text(60, .025, r'$\mu=100,\ \sigma=15$')
plt.xlim(40, 160)
plt.ylim(0, 0.03)
plt.grid(True)
plt.show()